How GIS Works
Combining Data
One of the greatest advantages of using GIS is its capacity to combine layers of data into a single map. The following graphics illustrate how multiple individual layers (or themes) can be combined for the purpose of performing complex queries.
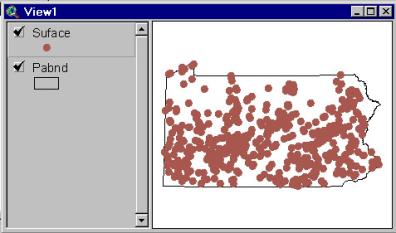
Theme 1: Surface water
These points represent surface water supply locations throughout Pennsylvania.
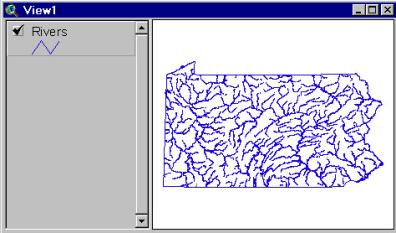
Theme 2: Rivers
These lines represent Pennsylvania rivers.
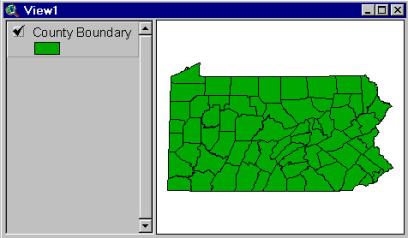
Theme 3: Counties
Pennsylvania county boundaries are represented by green polygons.
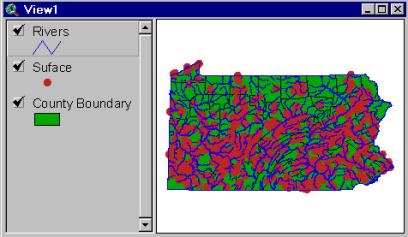
Theme 4: Surface water intakes, Rivers and County boundaries
The surface water intakes and rivers have been overlaid with the county boundaries to produce a single digital map that can be printed or used as input for both attribute and spatial queries. Layering data like this in a GIS allows users to analyze features in one theme, relative to features in another theme.
The following example provides an illustration of a geographic query that involves multiple thematic layers.