GIS Data Types
More Raster Examples
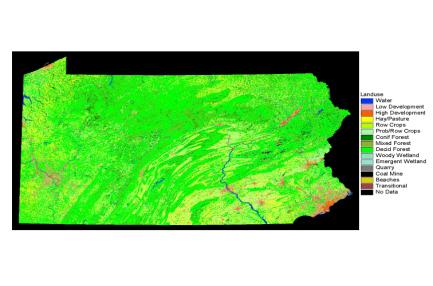
Satellite images and aerial photos are also examples of raster data layers that can be used within a GIS. Each cell, or "pixel", in the raster has a single value, which which corresponds to a feature in the real world. Groups of cells with the same value would define the point, path or area of a feature. Raster datasets are mainly used to describe continuous features, which don't have discrete boundaries, such as soils, landuse or elevation. Below is a raster example of the National Land Cover Data Set. This raster was acquired by the Multi-resolution land characterization (MRLC) consortium.
National Land Cover Dataset Developed from LandSat Thematic Mapper Satellite Imagery and produced as a cooperative project between the USGS and the US EPA
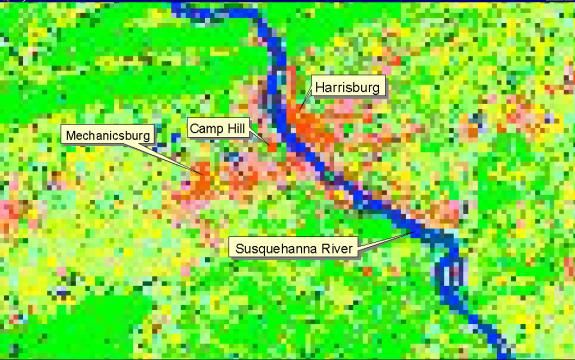
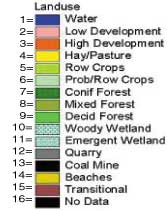
The graphic below shows an area of the National Land Cover Dataset, zoomed to the extent around Harrisburg, PA. In this landuse raster, cells with a value of 1 represent "water" and are symbolized in blue. The most dominant water feature on the map is the Susquehanna River. Cells that are dark red and have a value of three, represents "high development". You can see that the dark red areas on the map include Harrisburg, Camp Hill, and Mechanicsburg.
Raster data is organized into a structure composed of rows, and columns of rectangular cells. Each cell represents a specific area on the earth's surface. All cells within a raster are the same size, but cell size between raster datasets does vary. The size of each cell defines the resolution or amount of detail contained in the data. Generally, raster datatsets with small cells contain more information than those with larger cells. Your application should dictate the resolution of the data that you use. High resolution data provide a great deal of information, but are large in size, making them cumbersome to work with. There is also a greater cost associated with purchasing high resolution data, as the costs for collecting these data are generally much higher than for acquiring low resolution data.
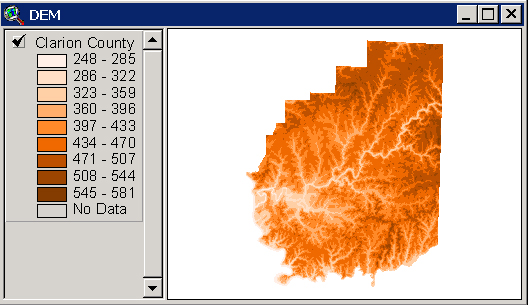
This is an example of a Digital Elevation Model (DEM). The U.S. Geological Survey has developed a National Elevation Dataset (NED). The NED is a seamless mosaic of best-available elevation data. Geospatial elevation data are used by the scientific and resource management communities for global change research, hydrologic modeling, resource monitoring, mapping, and visualization applications. This particular DEM has a resolution of 30 meters, which means that the elevation is assumed to be constant within each 30 x 30 meter cell. For many applications, this resolution, or amount of detail, would be sufficient. However, you can imagine how this data might not be useful for a road construction project that requires elevational data that are accurate to within one or two feet.