How GIS Works
Visualizing Your Data
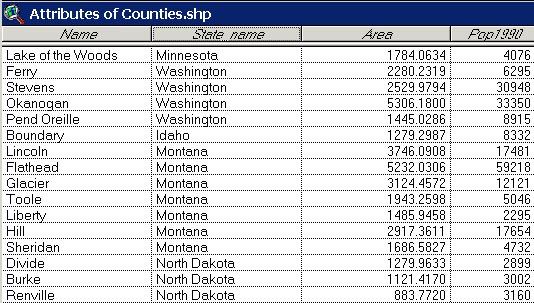
GIS databases are often large and complex collections of geographic features, and their corresponding attribute data. For example, the table below contains county-level population statistics for the United States. This particular database contains over 3,000 records (one for each county) and numerous columns of attributes, which include population, income, crime, etc.
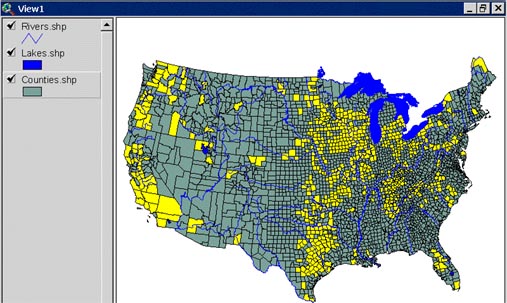
Like, standard database management systems, a GIS provides tools that enable a user to query, manipulate and summarize large quantities of data. Additionally, a GIS enables you to link the tabular attribute data with the mapped features so that you can visualize patterns in the data across space. The graphic below shows all counties that have more than 1000 farms. The mapping capabilities of a GIS make it easier to see patterns in the data.
It is not just the visualization of a database that makes a GIS so powerful but its ability to combine multiple thematic layers for the purpose of answering complex questions. Examples of thematic layers are roads, rivers or buildings to name a few. The ability to combine these layers in a GIS allows us to answer questions like: "Where are all of the rivers that are within 25 meters of a road?". We will show an example of this in the next section.