GIS Data Types
Vectors
Vectors can be classified into three primary feature types: points, lines and polygons. Vector data is entered into a GIS by digitizing these features from a base map. All vector data is stored as an x,y coordinate, or a series of x,y coordinates.
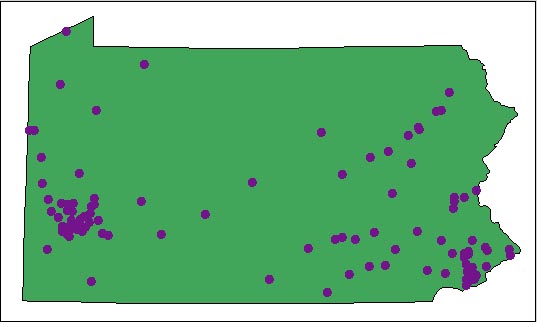
The image below contains all the cities in Pennsylvania. These cities are represented as points.
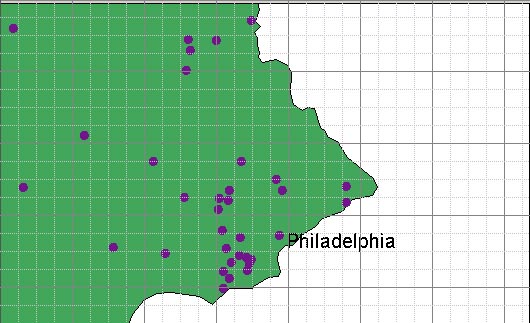
Locations on the earth surface are defined in terms of latitude and longitude. Data stored in a GIS are typically "projected" from a 3-dimensional sphere to a 2-dimensional (x, y) coordinate system. The graphic below shows a grid that represents a particular x, y coordinate system, such as Universal Transverse Mercator (UTM). If we were zoom in to Philadelphia, you would be able to see that this feature has an single location along the x and y axis. Other examples of point features could be wells, fire hydrants, or airport locations.
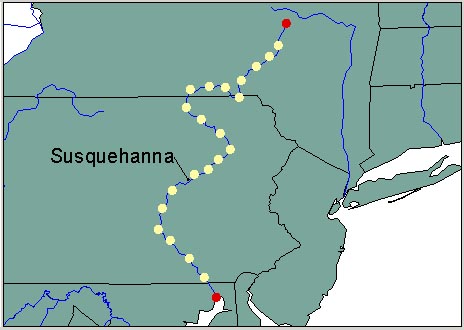
The image below shows a major river that flow through Pennsylvania. The Susquehanna River is represented by a line and is made up of a series of x,y coordinates.
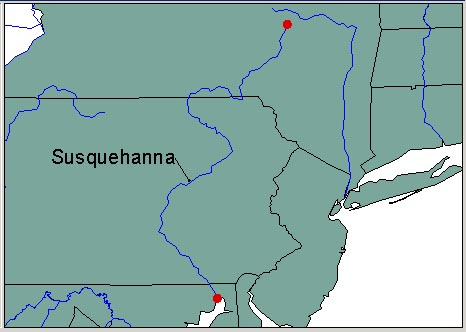
The line feature like the Susquehanna River, has a starting and ending point as indicated in red, and has a series of points between that form a line. In addition to location information a line feature has a length. Other examples of line features could be roads, pipelines, or railroads.
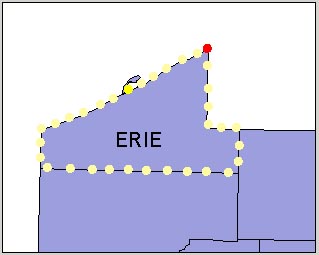
The image below contains all the counties in Pennsylvania and each county would be a polygon feature.
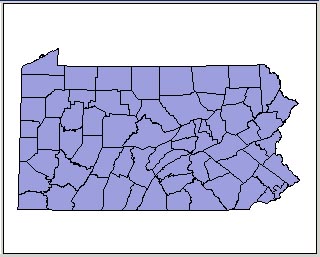
The polygon feature is also a series of x,y coordinates but it has the same beginning and ending point which closes the feature. This multi-sided figure represents an area on a map. In addition to location , polygons have attribute information such as its area or perimeter length. Example of polygons could be political boundaries, lakes or land parcels.